Centrifugal Fans
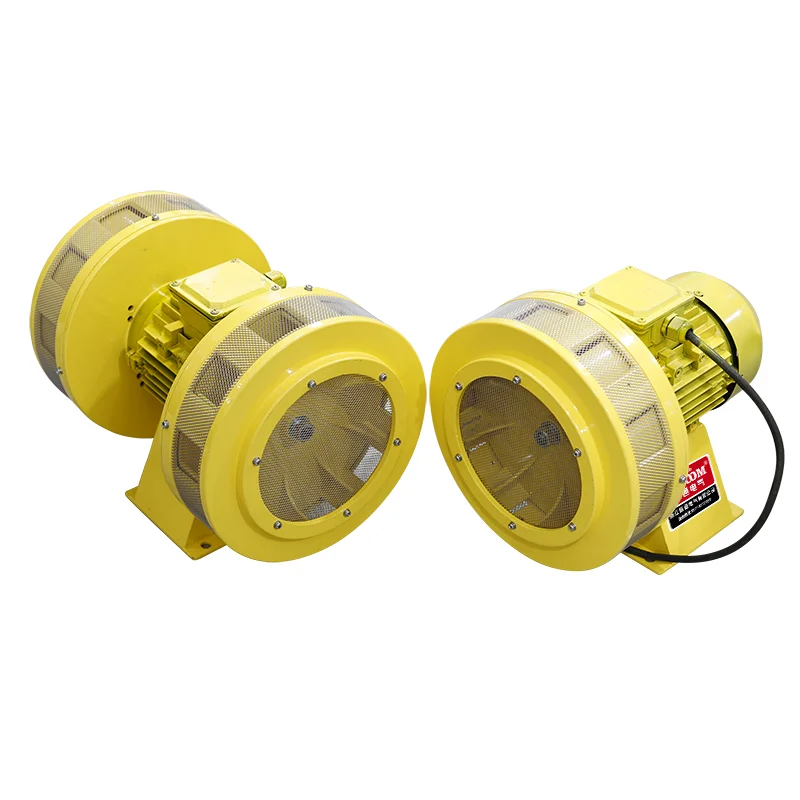
What Is a Centrifugal Fan Impeller
A centrifugal fan impeller is a rotating component that moves air or gases by centrifugal force, used in various applications.
Read More
Centrifugal fans are widely used in various industrial applications to move air or other gases. To select the appropriate fan for a specific application, it is essential to understand how to interpret the fan performance curves provided by manufacturers. These curves, often referred to as fan curves, plot the relationship between the fan’s airflow (CFM – cubic feet per minute), static pressure, and brake horsepower, which helps in determining the fan’s operating point and predicting its performance under different conditions.
This article will provide a comprehensive guide on how to read and interpret centrifugal fan curves effectively. We will discuss the different components of a fan curve, including the axes and curves, and provide a step-by-step approach to determining the fan’s operating point and calculating the required brake horsepower.
A typical centrifugal fan curve consists of three axes: the horizontal axis (X-axis) and two vertical axes (Y-axes).
The horizontal axis, or X-axis, represents the airflow in cubic feet per minute (CFM). This axis shows the volume of air the fan can move at different operating conditions. The airflow increases from left to right on the X-axis.
The vertical left axis, or Y-axis, represents the static pressure, usually measured in inches of water gauge (in. wg). This axis indicates the pressure the fan can generate at various airflow rates. The static pressure increases from bottom to top on the left Y-axis.
The vertical right axis, also a Y-axis, represents the brake horsepower (BHP) required to operate the fan at different airflow rates and static pressures. Brake horsepower is a measure of the power input to the fan shaft. The BHP increases from bottom to top on the right Y-axis.
A centrifugal fan curve typically features two main curves: the CFM vs. Static Pressure curve and the CFM vs. Brake Horsepower curve.
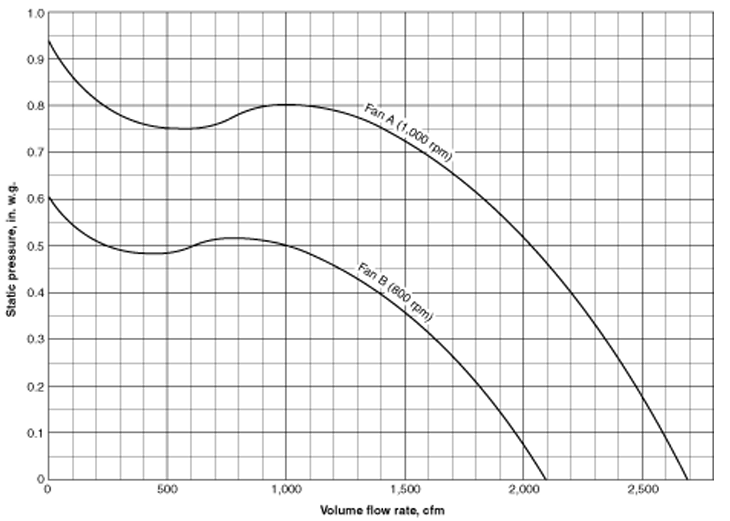
The CFM vs. Static Pressure curve, also known as the fan performance curve, shows the relationship between the airflow (CFM) and the static pressure (in. wg) generated by the fan. This curve is typically a downward-sloping line, indicating that as the airflow increases, the static pressure decreases. The shape of the curve depends on the fan’s design and operating speed.
The CFM vs. Brake Horsepower curve represents the relationship between the airflow (CFM) and the power input to the fan shaft (BHP). This curve is usually an upward-sloping line, indicating that as the airflow increases, the required brake horsepower also increases. The shape of the curve is influenced by the fan’s efficiency and operating speed.
To determine the fan’s operating point and calculate the required brake horsepower, follow these steps:
First, determine the airflow (CFM) required for your specific application. This value can be obtained from system design calculations or requirements.
Next, determine the static pressure (in. wg) the fan must overcome in your system. This value is based on the pressure losses in the ductwork, filters, and other components in the air handling system.
Using the airflow (CFM) and static pressure (in. wg) values from steps 1 and 2, locate the point on the CFM vs. Static Pressure curve where these two values intersect. This point is called the fan’s operating point, and it represents the fan’s performance at the specified conditions.
From the fan’s operating point determined in step 3, draw a horizontal line to the right until it intersects the CFM vs. Brake Horsepower curve. The point of intersection on the right Y-axis indicates the brake horsepower (BHP) required to operate the fan at the specified airflow and static pressure.
A centrifugal fan impeller is a rotating component that moves air or gases by centrifugal force, used in various applications.
Read More
Learn the steps to accurately measure the static pressure of a centrifugal fan using a manometer or pressure gauge.
Read More
Learn the steps to properly balance a centrifugal fan, reducing vibration and improving efficiency and fan life.
Read More