What Is the PQ Curve
PQ curves serve as a fundamental tool for analyzing the performance and operating characteristics of fans and blowers in the machinery industry. By graphically representing the relationship between airflow and static pressure, PQ curves enable engineers and technicians to select the most suitable fan for a specific application, optimize system design, and troubleshoot performance issues.
This blog post delves into the intricacies of PQ curves, exploring their components, factors influencing their shape, and the distinct differences among various fan types. We will equip you with the knowledge to interpret PQ curves effectively, empowering you to make informed decisions when designing, selecting, or maintaining fan systems in your industrial applications.
What Is PQ Curve
A PQ curve, also known as a performance curve or characteristic curve, is a graphical representation of a fan’s performance. It depicts the relationship between the airflow rate (Q) and the static pressure (P) that a fan can generate at various operating points. PQ curves provide essential information for selecting the appropriate fan for a specific application and understanding how it will perform under different conditions.
How Do You Read a PQ Curve
X-Axis: Airflow
The x-axis of a PQ curve represents the airflow, typically measured in cubic feet per minute (CFM) or cubic meters per hour (m³/h). Airflow indicates the volume of air that the fan can move over a given period. As you move from left to right along the x-axis, the airflow increases.
Y-Axis: Static Pressure
The y-axis of a PQ curve represents the static pressure, usually measured in inches of water gauge (inH2O) or pascals (Pa). Static pressure is the resistance that the fan must overcome to maintain a specific airflow. As you move up the y-axis, the static pressure increases.
Reading the Curve
To read a PQ curve, locate the point where the desired airflow (CFM or m³/h) on the x-axis intersects with the corresponding static pressure (inH2O or Pa) on the y-axis. This point falls on the fan’s performance curve, indicating the fan’s operating condition at that specific airflow and static pressure.
Identifying the Fan’s Operating Range
The PQ curve shows the fan’s performance across its entire operating range. The curve typically starts at the fan’s maximum static pressure and zero airflow, then slopes downward as airflow increases and static pressure decreases. The fan’s optimal operating range is usually in the middle section of the curve, where it achieves a balance between airflow and static pressure.
Comparing Multiple Curves
PQ curves often include multiple lines representing different fan speeds or configurations. By comparing these curves, you can determine which fan setup is most suitable for your specific application and operating conditions.
Factors Influencing PQ Curves
Impeller Design
The impeller design significantly influences the PQ curve.
- Forward-curved impellers generate higher airflow at lower static pressures, resulting in a steep PQ curve.
- Backward-inclined impellers produce higher static pressures at lower airflows, leading to a flatter PQ curve.
- Radial impellers fall between these two designs, offering a balance of airflow and static pressure.
Motor Type
The motor type affects the fan’s performance and, consequently, the PQ curve.
- AC induction motors are common in fan applications, providing reliable performance across a range of speeds.
- EC (Electronically Commutated) motors offer higher efficiency and more precise speed control, allowing for greater flexibility in meeting specific airflow and pressure requirements.
Number of Blades
The number of blades on the impeller impacts the PQ curve. Fans with fewer blades generally produce higher airflow at lower static pressures, while fans with more blades generate higher static pressures at lower airflows.
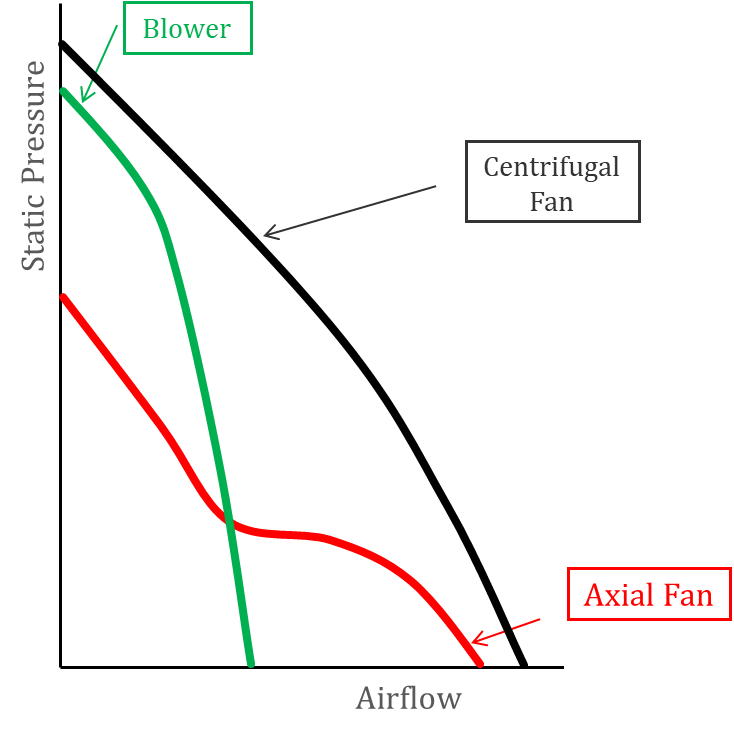
Differences in PQ Curves Among Various Fan Types
Different fan types exhibit distinct PQ curves due to their unique designs and operating principles.
Axial Fan
Axial fans move air parallel to the fan shaft, producing high airflow at low static pressures. Their PQ curves are typically steep, with airflow decreasing rapidly as static pressure increases. Axial fans are well-suited for applications requiring high airflow rates, such as ventilation and cooling.
Centrifugal Fan
Centrifugal fans use an impeller to draw air into the center and discharge it radially, generating higher static pressures than axial fans. The PQ curve of a centrifugal fan is generally flatter, maintaining relatively constant airflow over a wider range of static pressures. Centrifugal fans are ideal for applications demanding higher pressures, such as dust collection and air conditioning systems.
Blower Fan
Blower fans, also known as positive displacement blowers, operate by trapping a fixed volume of air and pushing it out of the discharge. They produce high static pressures at relatively low airflow rates, resulting in a very flat PQ curve. Blower fans are suitable for applications requiring constant airflow against varying resistances, such as pneumatic conveying and aeration.