How to Read a Fan Performance Curve
A fan performance curve typically consists of three key components: air volume flow rate (CFM), static pressure (SP), and brake horsepower (BHP). These components are plotted on a graph, with CFM on the x-axis and both SP and BHP on the y-axis, creating two distinct curves that demonstrate the relationship between air flow, pressure, and power consumption.
In the following sections, we will delve into the intricacies of CFM vs. SP curves, CFM vs. BHP curves, and system resistance curves. By the end of this blog post, you will have a solid foundation in reading and interpreting fan performance curves, empowering you to optimize fan selection and operation in your industrial setting.
Components of a Fan Performance Curve
Air Volume Flow Rate (CFM)
Air volume flow rate, measured in cubic feet per minute (CFM), quantifies the volume of air that a fan can move per unit time. CFM is one of the primary factors in determining a fan’s capacity to ventilate a space or cool equipment.
When analyzing a fan curve, the CFM is typically represented on the horizontal (x) axis. As you move to the right along this axis, the CFM increases, showing the fan’s capacity at higher flow rates.
Static Pressure (SP)
Static pressure (SP), often measured in inches of water gauge (in. w.g.), represents the pressure that a fan must overcome to deliver the desired airflow. This includes resistance from ducts, filters, dampers, and other components in the system.
On a fan performance curve, the SP is usually displayed on the vertical (y) axis. As you move up this axis, the SP increases, indicating the fan’s ability to operate against higher system pressures.
Brake Horsepower (BHP)
Brake horsepower (BHP) is the power required by the fan to operate at a given point on the performance curve. It accounts for the fan’s efficiency in converting electrical or mechanical power into airflow work.
BHP curves are often overlaid on the fan performance graph, showing the power consumption at various combinations of CFM and SP. Analyzing the BHP helps in selecting an appropriately sized motor and evaluating the fan’s energy efficiency across its operating range.
CFM vs. SP Curves
Fan performance curves typically plot the relationship between the air volume flow rate (CFM) on the x-axis and the static pressure (SP) on the y-axis. These “CFM vs. SP” curves characterize how much air the fan can move against different levels of resistance or pressure.
As static pressure increases, the volume of air that the fan can move decreases. This inverse relationship traces out a curve that slopes downward from left to right. The exact shape and slope of the curve depends on the fan’s design, such as the shape and angle of the blades.
Fans are usually designed to operate near the middle of their performance curve, where they are most efficient. Operating a fan too far to the right (high SP, low CFM) risks overloading the motor, while running too far to the left (low SP, high CFM) may result in unstable airflow and inefficiency.
Multiple CFM vs. SP curves may be plotted on the same graph to show how the fan performs at different speeds (RPM). Curves for higher RPMs will generally be shifted up and to the right compared to lower RPM curves.
CFM vs. BHP Curves
In addition to CFM vs. SP, fan performance charts often include “CFM vs. BHP” curves. BHP stands for brake horsepower and represents the actual mechanical power output of the fan’s motor.
CFM vs. BHP curves typically have a “humped” shape, with BHP rising to a peak near the middle of the CFM range before curving back down. This peak represents the maximum load the motor can handle.
The CFM vs. BHP curve is useful for ensuring the fan is operating within the acceptable limits for the motor. Overloading the motor by operating too far past the BHP peak can cause overheating and premature failure.
Like with CFM vs. SP, there may be multiple CFM vs. BHP curves on the same chart reflecting different fan speeds. Higher RPM curves will be shifted higher on the BHP (y) axis.
System Resistance Curve
Another key element of fan performance charts is the system resistance curve. This curve, often shown as a dashed line, represents the static pressure requirements of the specific air system the fan is operating in.
The system curve slopes upward, showing how the pressure drop across the system increases with increasing airflow. Longer ductwork, more fittings, and obstructed filters all increase system resistance.
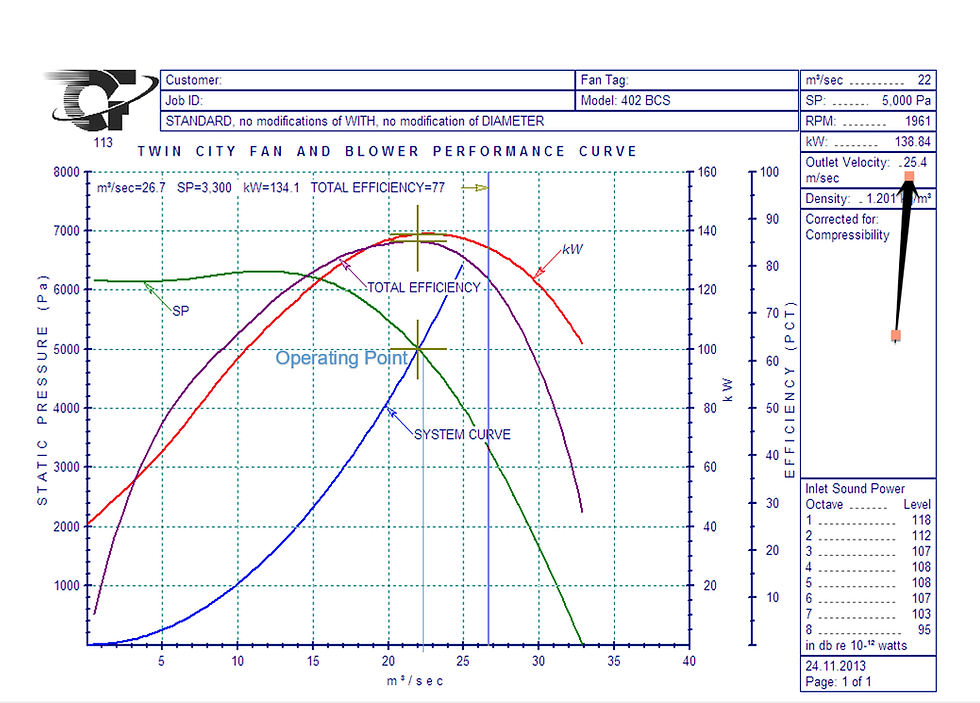
The point where the system curve intersects the fan’s CFM vs. SP curve is known as the operating point. This is the CFM and SP the fan will actually achieve when installed in that specific system.
Modifying the system, such as changing duct sizes or adding/removing components, will shift the system curve and thus the operating point. For efficient fan operation, the system should be designed such that its resistance curve intersects the fan curve very close to the fan’s peak efficiency point.
Step-by-Step to Read a Fan Curve
Step 1: Locate the Airflow and Static Pressure Axes
The first step in reading a fan performance curve is to identify the axes. The horizontal or x-axis represents the airflow, typically measured in cubic feet per minute (CFM). The vertical or y-axis indicates the static pressure, usually in inches of water gauge (in. w.g.).
Step 2: Find the Fan’s Operating Point
Next, locate the point on the fan curve that corresponds to your system’s airflow and static pressure requirements. This is known as the fan’s operating point. The operating point is determined by the intersection of the system resistance curve and the fan performance curve.
Step 3: Determine the Brake Horsepower
From the operating point, draw a vertical line upwards until it intersects with the brake horsepower (BHP) curve. The BHP curve shows the amount of mechanical power required to operate the fan at different airflows. This intersection indicates the BHP needed for the fan to deliver the specified airflow and static pressure.
Step 4: Check the Fan’s Efficiency
Most fan performance curves also include efficiency lines or isoefficiency contours. These lines indicate the fan’s efficiency at various operating points. Efficiency is expressed as a percentage, with higher percentages representing more efficient operation. Aim to select a fan that operates near its peak efficiency point for optimal performance and energy savings.
Step 5: Consider the Fan’s Limits
Be aware of the fan’s maximum and minimum operating limits. Running a fan too far to the left or right of its performance curve can lead to inefficient operation, increased noise, and potential damage. Fans should be sized and selected to operate within their recommended range for longevity and optimal performance.
Step 6: Compare Multiple Fan Curves
When selecting a fan for your application, compare performance curves from different fan models or manufacturers. This allows you to find the fan that best meets your airflow, static pressure, and efficiency requirements.